The Report Builder functionality provides extensive capabilities for report creation with the use of Microsoft Reporting Services Report Builder. Using Report Builder allows the system administrator the ability to modify the appearance of results from Temenos Infinity's basic report functionality. This provides institutions with the transparency and visibility to present a visually appealing snapshot of data that supports and emphasizes key data points. Other capabilities include:
- Summarization of data
- Graphs and Charts for data visualization
- Calculations and expressions of data within or across accounts that may not be available
- Incorporating sub-reports to demonstrate a chart and table within the same report
- Joining tables that are not currently related to one another
Prior to using the Report Designer functionality, review the Reports section in the System Administrator guide to get a basic understanding of the Report feature. The report builder can be used in variety ways, such as:
- Start with a Standard Report and build the report in Temenos Infinity as it is normally done. Add in desired fields and necessary criteria. From there, use the Report Builder to modify how the results look.
- Start from scratch and create a new report, and specify that it should be an Advanced Report.
- Copy a predefined report. With the Report Builder, users are able to modify the canned reports.
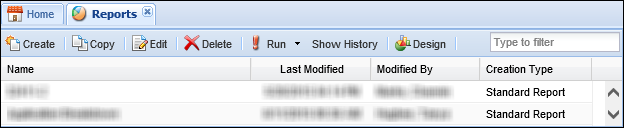
The Report Builder can be launched from the Report Window by selecting  .
.
Report Builder Navigation
When the report builder is launched, the design surface displays. The design surface is used to view and manipulate the layout of the report and is broken out into four main sections.
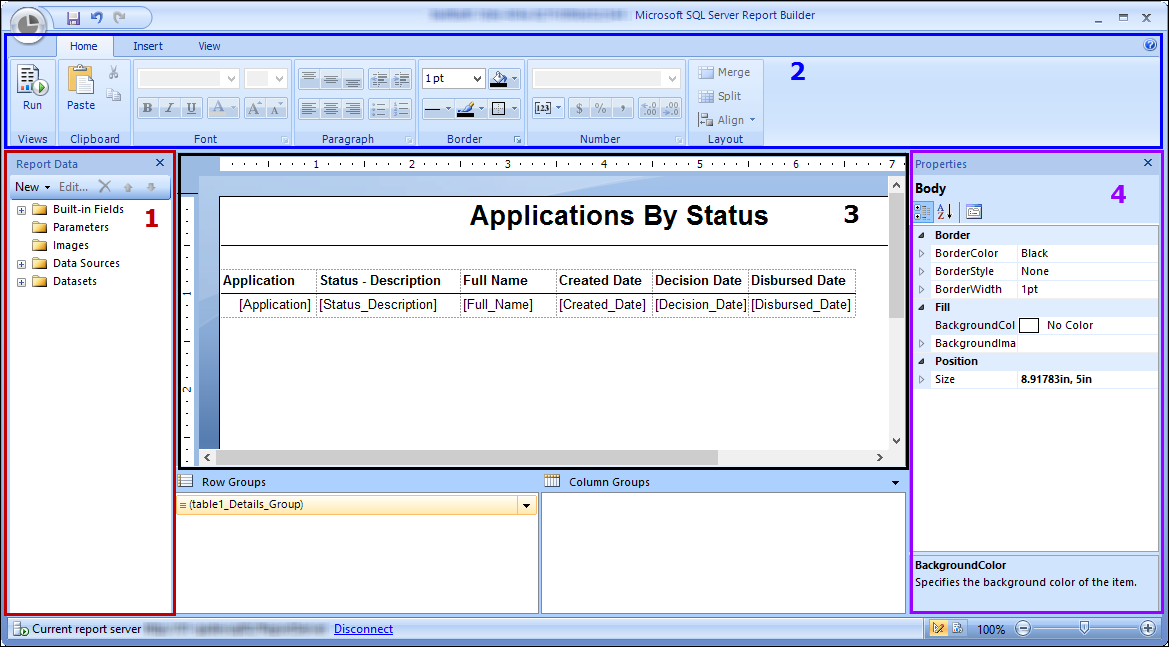
The following table provides an overview of each section of the design surface:
| Design Surface Section |
Description |
| 1 - Report Data |
Displays information about what fields are being used and the connection to the data source. |
| 2 - Home/Insert/View tabs |
Provides the ability to format text, insert other design parts, or change which parts of the Design Surface are displayed. |
| 3 - Design Surface Area |
Provides the ability to set up reports. |
| 4 - Properties |
Provides the ability to modify parts of a table such as spacing, borders, or background colors. |
 |
Reference the following list for an overview of tips to consider when creating a parameter in the Report Builder:
- Avoid having both an underscore and last character in the Name.
- For vendor reports, the Vendor Id parameter Name and Prompt must be "VendorId."
|
Report Builder – Getting Totals
Locate the report in the Report listing page that is used with the Report Builder and click Design.
The selected Report displays in the Design Surface. The report fields and criteria are already set, and the layout displayed can be deleted and a new table can be inserted.
To delete the layout of the report:
- Click anywhere in the table in the Design Surface and a bar appears across the top and down the left side of the table. These bars represent the columns and rows of the table.
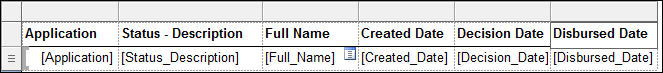
- Clicking on the box in the top left corner selects the entire table.

- Click Delete to clear the Design Surface.
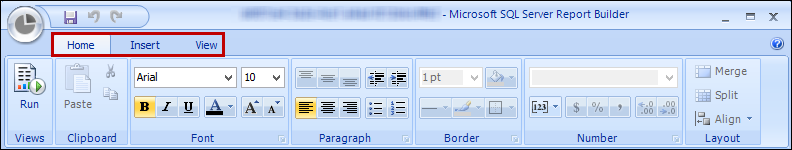
At the top of the Report Builder there are three tabs:
- Home – Run the report or modify the formatting of the report.
- Insert – Select how the data displays (table, chart, etc.).
- View – Select the portions of the design page to be displayed.
To add a new layout:
- Click Insert > Table > Table Wizard.
- Select a Dataset. Choose an existing dataset in this report is set by default. The DataFields dataset displays the fields that were chosen in the Report Writer.
- Click Next.
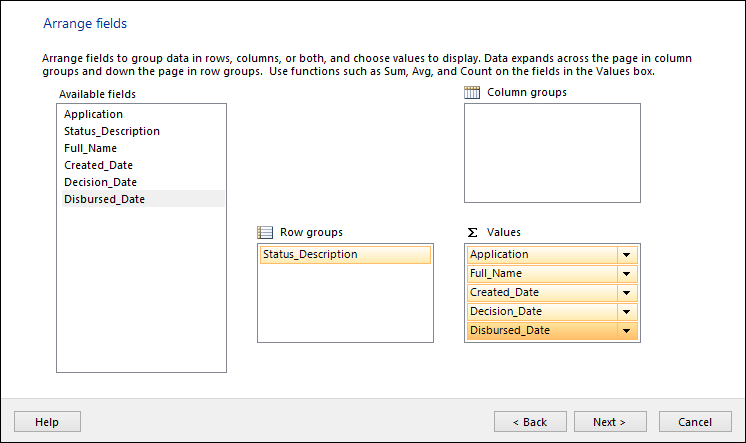
- The Arrange Fields screen displays. Drag Available fields to the desired rows/groups/values section.
- Row Groups – The fields listed down the left side of the table.
- Column Groups – The fields listed in the columns.
- Values – Define the values.
- Click Next.
- Select the layout of the report. Depending on the selection made in the prior set may pre-set the layout (i.e. Choosing to sum the Balance the layout is pre-set to show subtotals and grand totals).
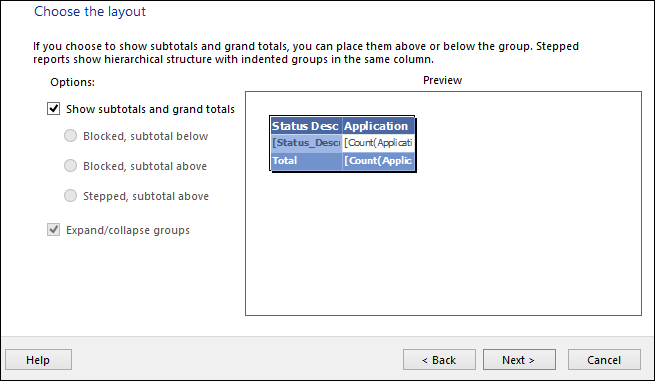
- Click Next.
- Select the style for the report. Changing the style does not affect the layout; it only changes the fonts and color scheme of the results.
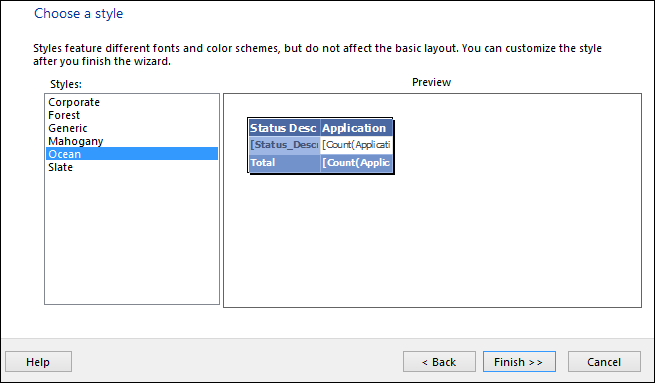
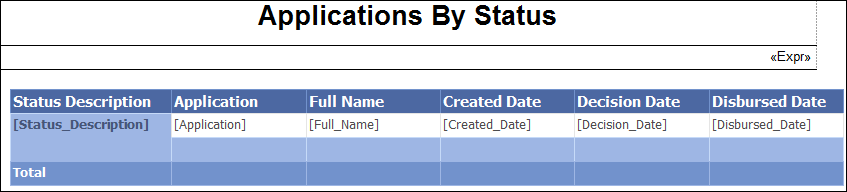
- Click Finish. The table displays in the Design Surface and is now ready to be used. Clicking the
 control at the top left corner of the table allows users to re-position the table and resize the table.
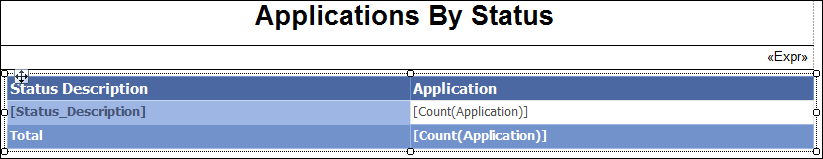
Click Run to view the results.
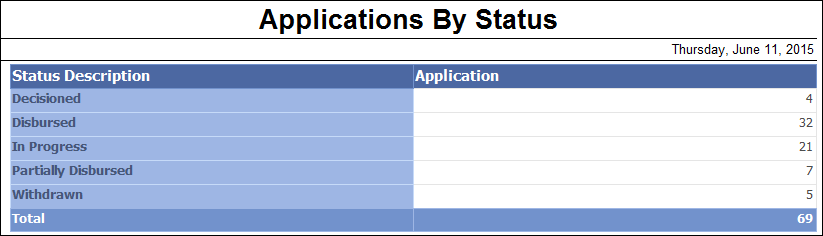
The Report Builder – Expandable Groups
Expandable groups allow users to expand groups to view more information contained therein.
- Click Design.
- Select the entire table, and delete the table.
- Select Insert > Table > Table Wizard.
- Select the DataFields dataset.
- Select an Available Field to add to the Row Groups window.
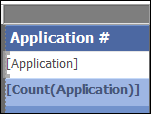
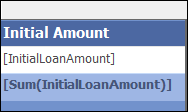
- Add fields to be displayed in the group to the Values section.
 |
Do not make any changes in the Values box with regards to Sum, Count, etc. |
- Click Next and complete the remaining sections.
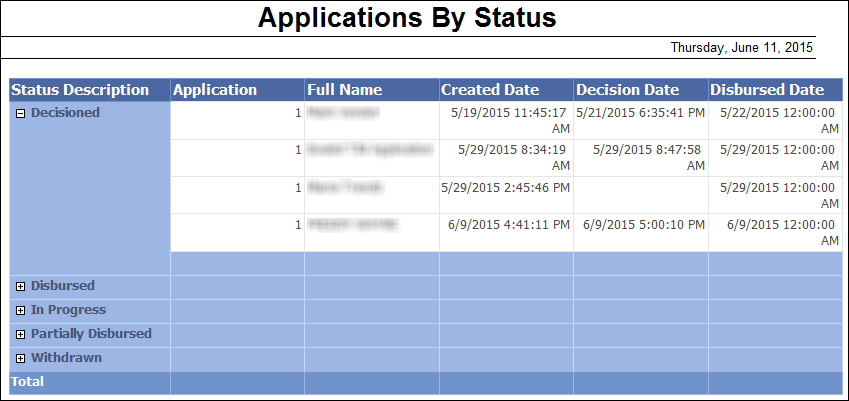
- Click the Run button from the Home tab. The groupings display.

Table formatting can be modified in the Design tab.
To modify the report to display subtotals follow the below steps for the desired fields:
- Hover over the light blue row right below the field for which the subtotal should display. When the field chooser appears, click on it and select the field name.

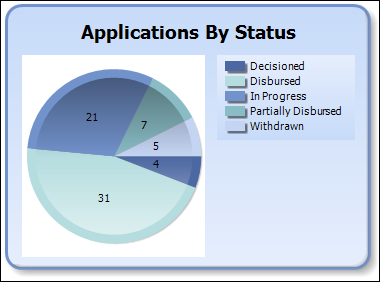
The Report Builder – Creating a Chart
- Adding Charts to a report allows users to represent things visually.
- To add a chart select the Design tab.
- Select Insert > Chart > Chart Wizard.
- Click Next through the dataset.
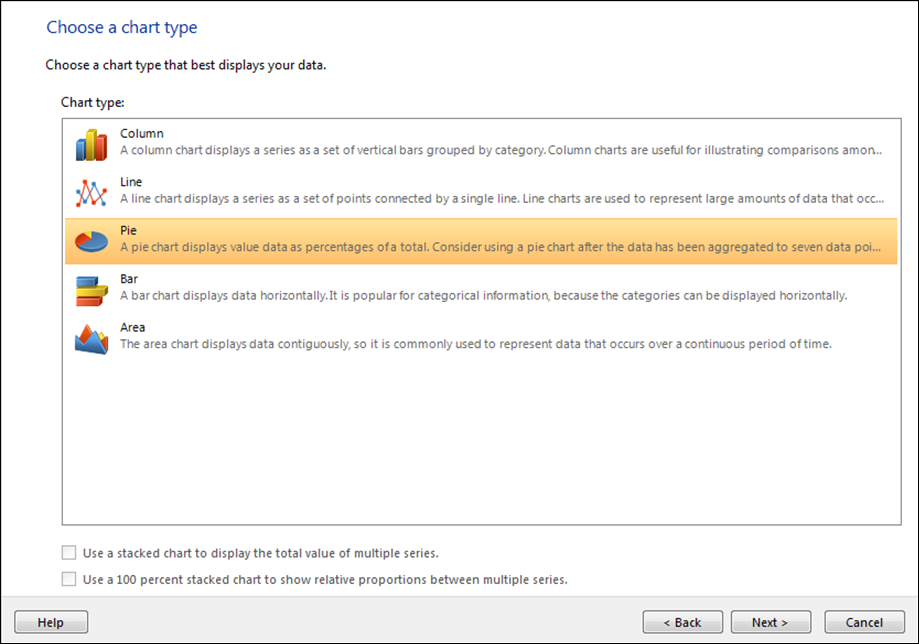
- Select the type of chart and click Next.
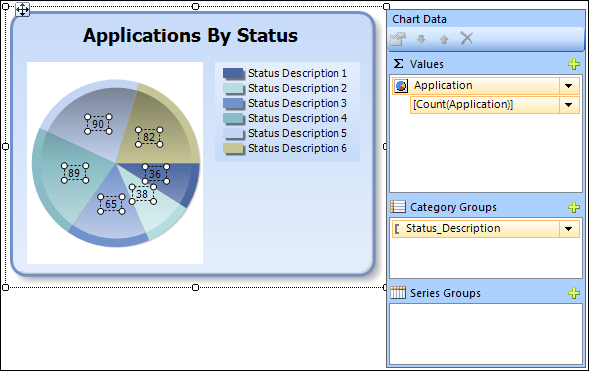
- Complete the Arrange Chart Fields step.
- Select Next.
- Select the Style.
- Click Finish.
- Relocate the pie chart design on the design surface.
- Click on the Chart Title and type in a title.
- Right-click anywhere on the chart and choose Show Data Labels.
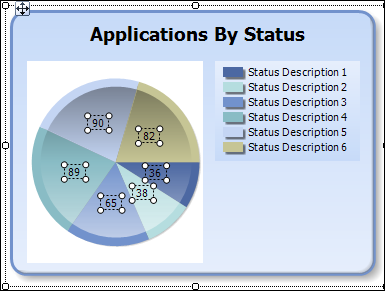
- With each segment of the pie chart selected (as shown above), go to the Home tab and choose the format for these fields.
- Run the report. Adjust the size if needed.